
This warning usually appears together with the dashboard message:

More than 75% used in the configuration cacheTogether, these messages indicate that the cache allocated for Zabbix events and configuration data is too small. In many cases, this is only a temporary situation. For example, a proxy may have been disconnected for a longer period and then starts sending a large number of queued events back to the central Zabbix server all at once.
In your case, the issue appeared after a Zabbix upgrade. Once the proxies reconnected, they delivered their stored events, and that created a temporary load spike that exceeded the available cache size.
What the message means
The value cache is used by Zabbix to store frequently accessed data in memory. If that cache becomes too small, Zabbix falls back into a low memory mode and starts warning that the cache is under pressure. This does not always mean the system is broken, but it is a clear sign that the current cache size is no longer sufficient for the workload.
In larger environments, this can happen after upgrades, after proxy reconnects, or during periods of unusually high event volume. If the cache remains too small for a longer time, performance can degrade and Zabbix may become slower when processing new events or queries.
How to fix it
The cache size must be adjusted in the Zabbix server configuration file on the Zabbix server. The configuration file is located in:
/etc/zabbix
Open the file zabbix_server.conf with a text editor such as Nano and search for the cachesize parameter.
Example:
sudo nano /etc/zabbix/zabbix_server.conf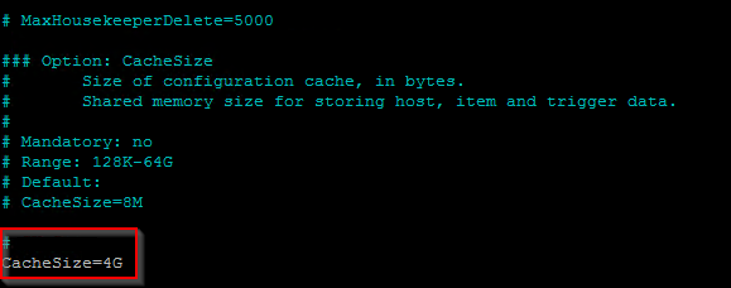
The current value in your case is set to 4GB. If the system keeps reporting cache pressure, this value should be increased to give Zabbix more room for events and configuration data.
After saving the file, restart the Zabbix server service so the new setting is loaded:
sudo systemctl restart zabbix-serverWhy this happened
This kind of issue is often temporary and can be triggered by a sudden backlog of data. A proxy that was offline for some time may reconnect and forward many events at once. After a Zabbix update, the system may also briefly experience a higher load because proxies and the server need to catch up with pending data.
That is why cache-related messages are not always a sign of a permanent configuration problem. However, if they appear repeatedly, increasing the cache size is the correct long-term fix.
Short conclusion
The messages about low memory mode and configuration cache usage mean that the Zabbix server cache is under pressure. In your case, the most likely cause was the event backlog after the upgrade and proxy reconnects. Increasing the cachesize value in zabbix_server.conf and restarting the Zabbix server should resolve the issue.