
A Zabbix warning about low memory mode can appear together with the dashboard message:

More than 75% used in the configuration cacheTogether, these messages indicate that one of the Zabbix server caches is under pressure. This can happen temporarily after an upgrade, when disconnected proxies reconnect and send a large backlog of queued events to the central Zabbix server.
In this case, the problem appeared after a Zabbix upgrade. Once the proxies reconnected, they delivered their stored events and caused a temporary load spike that exceeded the available cache capacity.
What the Warning Means
Zabbix uses several caches to store configuration data and historical item values in memory. If the available cache is too small, Zabbix can switch to low memory mode and log warnings.
This does not necessarily mean that the Zabbix server is broken. However, it indicates that the configured cache size may no longer be sufficient for the current workload.
The issue can occur after:
- Zabbix upgrades.
- Proxy reconnects.
- Large event backlogs.
- An increase in monitored hosts or items.
- Periods of unusually high event volume.
If the cache remains under pressure, Zabbix performance may degrade and the server may process events and queries more slowly.
How to Fix the Problem
First, identify which cache is reporting the warning. Zabbix 7.4 provides separate configuration parameters for different caches. For example, CacheSize controls the configuration cache, while ValueCacheSize controls the history value cache.
The Zabbix server configuration file is usually located at:
/etc/zabbix
Open the file with a text editor:
sudo nano /etc/zabbix/zabbix_server.confDepending on the warning, adjust the relevant parameter. For a configuration-cache warning, check:
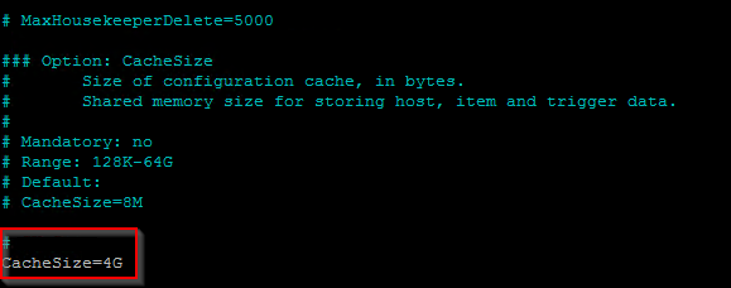
The exact parameter is important. Increasing ValueCacheSize does not resolve a warning caused by the configuration cache.
Zabbix documents ValueCacheSize as the shared memory size used for caching historical item values. The documented range in Zabbix 7.4 is 128 KB to 64 GB.
Increase the affected cache gradually and make sure the server has enough available RAM. For example:
CacheSize=8Gor:
ValueCacheSize=8GAfter saving the file, restart the Zabbix server:
sudo systemctl restart zabbix-serverCheck the service status:
sudo systemctl status zabbix-serverWhy This Happened
The warning was most likely caused by a temporary event backlog after the upgrade.
A proxy that was offline for some time can store data locally. When communication with the Zabbix server is restored, the proxy forwards the queued data. Several reconnecting proxies can create a significant load spike.
After the backlog has been processed, cache usage may return to normal. If the warning appears repeatedly, the configured cache size is probably too small for the current environment and should be increased permanently.
Conclusion
Low memory mode and cache-usage warnings indicate that a Zabbix server cache is under pressure. After an upgrade, the most likely cause can be a backlog of events delivered by reconnecting proxies.
Check which cache is affected, increase the corresponding parameter in zabbix_server.conf, and restart the Zabbix server. For recurring warnings, monitor cache usage and adjust the cache size according to the actual workload and available memory.